
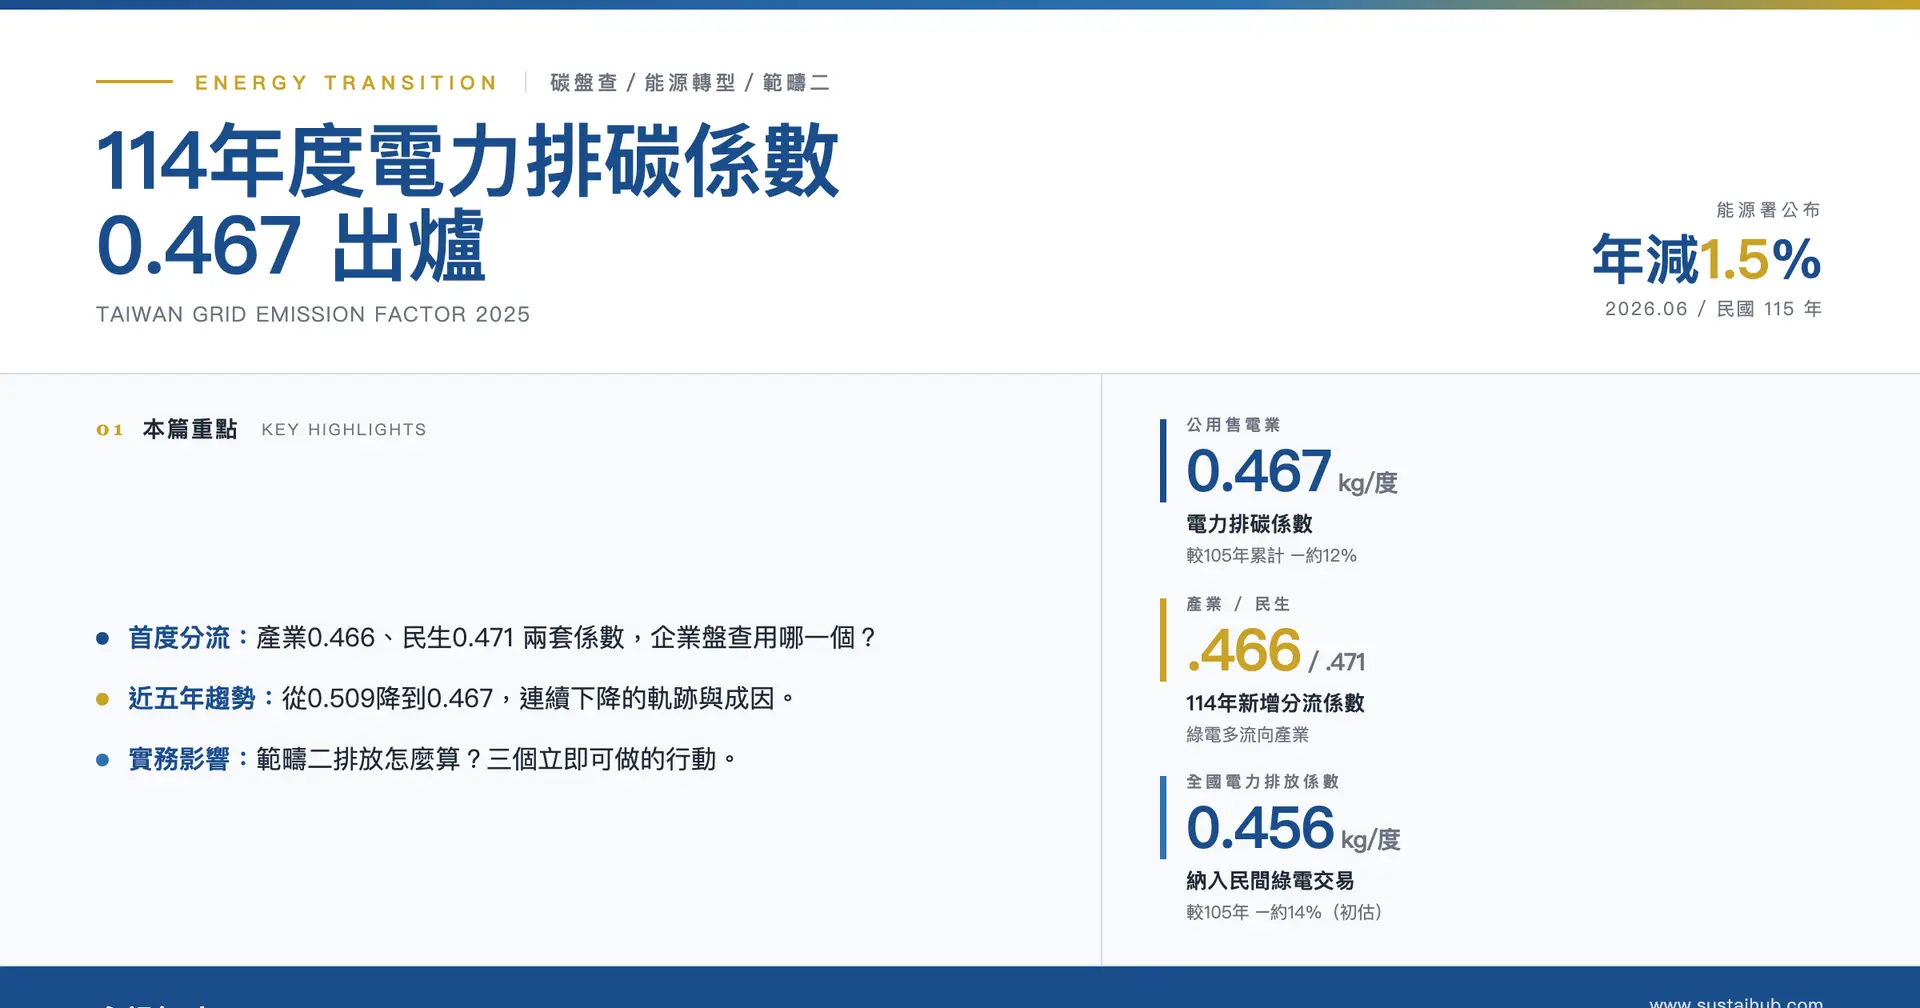
On 2 June 2026, the Ministry of Economic Affairs' Energy Administration announced the FY2025 (ROC year 114) public electricity retailer emission factor at 0.467 kg CO₂e/kWh, down approximately 1.5% from 0.474 in FY2024 (ROC year 113) and approximately 12% from FY2016 (ROC year 105). For companies preparing GHG inventories, reporting Scope 2 emissions or responding to global supply chain decarbonisation requirements, this annually updated figure is a key benchmark for calculating electricity carbon footprints. (ROC years in this article are accompanied by Gregorian years: 114=2025, 113=2024, 112=2023, 111=2022, 110=2021 and 105=2016.)
For the first time, from FY2025 (ROC year 114), the Energy Administration also introduced separate industrial electricity emission factors and residential electricity emission factors, while publishing a preliminary national electricity emission factor that includes private green electricity trading. This article explains the differences among these four figures, five-year trends and implications for corporate carbon inventories and disclosures.
For sustainability and finance teams, the electricity emission factor is an annual inventory parameter. It is used by TWSE/TPEx-listed companies preparing sustainability reports and disclosing GHG inventories under Financial Supervisory Commission (FSC) requirements, supply chain vendors submitting product carbon footprints, and exporters addressing EU Carbon Border Adjustment Mechanism (CBAM) reporting. Each update requires recalculation of Scope 2 emissions, making correct understanding of its definition and application essential.
The Four FY2025 Factors at a Glance
Unlike previous years, the FY2025 (ROC year 114) announcement replaces a single factor with a set of factors. Companies must identify their electricity tariff category and purpose before selecting the appropriate factor for inventories and disclosure. The four main values are:
Previously, most companies used the same public electricity retailer average factor regardless of electricity use. From FY2025 (ROC year 114), separate industrial and residential factors primarily reflect greater green electricity procurement by industry in recent years. Export manufacturers may use the applicable industrial factor when calculating indirect emissions under the relevant rules.
1. Scope: Measures average electricity emissions across all electricity sold by public electricity retailers, providing a basis for electricity regulatory oversight.
2. Given greater green electricity procurement by industry, the FY2025 (ROC year 114) factor for industrial inventories is 0.466 kg CO₂e/kWh, applicable to the following tariff categories: commercial metered lighting, low-voltage power, high-voltage power and extra-high-voltage power users.
3. Non-commercial metered lighting and flat-rate lighting users apply an electricity emission factor of 0.471 kg CO₂e/kWh.
What Is an Electricity Emission Factor? Three Easily Confused Terms
Although “electricity emission factor” sounds like a single measure, policy documents use at least three terms with different calculation boundaries. Clarifying these definitions makes the differences in figures easier to understand.
Public electricity retailer emission factor
This is the most frequently cited figure and a primary input to corporate carbon inventories. It measures carbon emissions per kWh of electricity sold through the Taipower system. The official formula is:
(Emissions associated with electricity sold wholesale to public electricity retailers by generators and self-use generation facilities − emissions allocated to line losses) ÷ total electricity sales by public electricity retailers
In simple terms, total carbon emissions from national power generation, less emissions allocated to transmission and distribution losses, are divided by electricity actually sold to users. The FY2025 (ROC year 114) figure is 0.467.
Two details are easily overlooked. First, the factor measures electricity sold rather than generated, so transmission and distribution losses are already considered; companies need not add them separately. Second, it is a retrospectively calculated annual average. The factor announced for ROC year 114 reflects the actual mix of coal, gas, oil, nuclear and renewable generation across Taiwan in the preceding settlement year. It is therefore not a real-time value but the result of that year's overall electricity mix. As coal's share falls and green electricity and gas increase, the factor decreases.
National electricity emission factor
Building on the public electricity retailer factor, the national factor also includes renewable electricity supplied directly or wheeled through private green electricity trading. In other words, it counts clean electricity that companies buy directly from green electricity providers outside the Taipower system, giving a fuller picture of national electricity emissions. The preliminary FY2025 (ROC year 114) value is 0.456, below the public retailer factor and reflecting growth in private green electricity trading. The national factor is usually finalised later than the public retailer factor, so it is commonly announced as a preliminary estimate pending settlement of trading data. Companies should distinguish preliminary from final versions and follow the Energy Administration's final announcement.
Comparing the Definitions and Users of Three Types of Factor
| Factor | FY2025 (ROC year 114) value | Calculation scope | Main users / purpose |
|---|---|---|---|
| Public electricity retailer emission factor | 0.467 | Average emissions from electricity sold through the Taipower system | Benchmark for general electricity carbon inventories |
| Industrial electricity emission factor | 0.466 | Industrial electricity within public retailer sales | Commercial metered lighting, low-, high- and extra-high-voltage power users |
| Residential electricity emission factor | 0.471 | Residential electricity within public retailer sales | Non-commercial metered lighting and flat-rate lighting users |
| National electricity emission factor | 0.456 | Also includes private green electricity direct supply and wheeling | Reflects national electricity emissions overall |
The electricity emission factor measures carbon (kg CO₂e/kWh), not money. It is used only to calculate GHG emissions and is unrelated to electricity prices or tariff adjustments. Using the wrong year or category is a common inventory mistake that can require recalculating the entire dataset and undermine external disclosure credibility.
New FY2025 Categories: Industry 0.466 vs Residential 0.471
The main FY2025 (ROC year 114) change subdivides the public retailer factor into industrial and residential categories. The industrial factor of 0.466 and residential factor of 0.471 differ by 0.005, primarily reflecting differences in green electricity procurement shares across the two sectors.
Why Is the Industrial Factor Lower?
The key is where green electricity goes. To meet global supply chain requirements, such as RE100, customer demands and EU CBAM, industry has purchased substantial green electricity through various channels. Most enters the industrial sector, lowering the carbon content of the electricity it actually uses. Residential procurement is lower, leaving its average carbon content slightly higher.
A combined factor gives industry and households the same average. Separate factors reflect each sector's green electricity procurement, bringing the figures closer to their actual electricity use patterns.
The Energy Administration announcement specifies the industrial electricity emission factor of 0.466 for industrial carbon inventories. It better reflects the industrial electricity mix and supports exporters' indirect-emissions calculations and responses to international decarbonisation requirements.
Which Figure Should Companies Use for Carbon Inventories?
Companies engaged in production or commercial activities should use the industrial electricity emission factor of 0.466 for Scope 2 inventories and disclosures. Three points still matter: follow requirements specified by regulators or verification bodies, such as the Ministry of Environment, FSC or third-party assurance provider; account separately for purchased green electricity or certificates under the market-based method to avoid double counting; and check that factor years are consistent in reports spanning multiple years. If unsure of the category, ask the verifier or adviser directly. Incorrect factors are often discovered only during verification, requiring the inventory to be redone.
For carbon inventories and Scope 2 calculations, companies should use the electricity emission factors formally announced by the Energy Administration for the relevant year, selecting by tariff category: 0.466 for industrial users and 0.471 for residential non-commercial metered lighting and flat-rate lighting users. Do not estimate factors independently or reuse previous years' figures. The applicable factor and calculation method remain subject to requirements of the Ministry of Environment, FSC or verification/assurance body.
Five-Year Trend: From 0.509 to 0.467
Over a longer period, the public electricity retailer emission factor has declined year by year. The following shows the past five years, ROC years 110–114, or 2021–2025:
Five-Year Cumulative Decline and Base-Year Comparison
From 0.509 in FY2021 (ROC year 110) to 0.467 in FY2025 (ROC year 114), the factor fell by 0.042 kg CO₂e/kWh over five years, a cumulative decline of approximately 8.3%, averaging about 2% annually. Against the FY2016 (ROC year 105) baseline of 0.529, the cumulative decline reaches approximately 12%. Although the drop from ROC year 112 to 113 was more pronounced (0.494→0.474, approximately −4%), the overall direction is consistently downward.
Annual declines vary. FY2022–2023 (ROC years 111–112) was almost flat (0.495→0.494, just −0.2%), reflecting electricity demand growth largely offsetting added green supply. The sharper FY2024 fall coincided with coal unit retirements and additional gas and green generation. The factor does not fall uniformly; it depends on plant retirements, new grid connections and completed renewable projects. Companies setting multi-year decarbonisation baselines and modelling scenarios, such as for SBTi targets, should account for this non-linearity rather than assume a fixed annual decline.
| Year (ROC / Gregorian) | Public electricity retailer factor | Year-on-year change | Cumulative change from ROC year 105 |
|---|---|---|---|
| 105 (2016, base year) | 0.529 | — | — |
| 110(2021) | 0.509 | — | −3.8% |
| 111(2022) | 0.495 | −2.8% | −6.4% |
| 112(2023) | 0.494 | −0.2% | −6.6% |
| 113(2024) | 0.474 | −4.2% | −10.4% |
| 114(2025) | 0.467 | −1.5% | Approximately −12% |
Five consecutive years of decline, alongside a national factor of 0.456 below the public retailer factor of 0.467, indicate progress in both low-carbon supply and private green electricity trading. At unchanged electricity use, companies' reported Scope 2 emissions decrease slightly as the factor falls. However, the gap to the 0.424 policy benchmark means companies should not rely solely on this passive decline.
Why Do Emissions Keep Falling? Three Drivers of the Energy Transition
The annual decline is not automatic; it results from changes in the energy mix. An electricity emission factor is average carbon content per kWh. Lowering it requires less CO₂ per unit of electricity generated—in practice, replacing high-carbon sources with low- or zero-carbon sources. The Energy Administration attributes the decline to the energy transition, expanded low-carbon electricity supply and an improved thermal generation mix. These translate into three main drivers.
-
1Driver 1: Expanding Renewable Energy Capacity
Solar and offshore wind capacity are growing rapidly each year, increasing green electricity's share of total generation. Every kWh replacing coal or oil generation lowers the overall factor, making renewables a central policy priority. -
2Driver 2: Improving Thermal Generation by Replacing Coal with Gas
While renewables cannot yet fully support baseload supply and dispatch needs, the government is gradually replacing high-carbon coal units with lower-carbon natural gas units. Gas emits substantially less carbon per kWh than coal, making coal-to-gas switching a key transitional measure. -
3Driver 3: Growth in Private Green Electricity Trading
Industry purchases large volumes of renewable electricity through direct supply and wheeling to meet customer and supply chain requirements. Although this electricity does not necessarily pass through the Taipower system, it lowers national electricity emissions—the main reason the national factor of 0.456 is below the public retailer factor of 0.467.
These drivers reinforce one another. Renewables provide the main source of reductions but are intermittent: solar generates in daylight and wind depends on conditions, so they cannot yet provide round-the-clock supply alone. During the transition, quickly dispatchable, relatively low-carbon gas units fill supply gaps and maintain grid stability. Private trading lets companies obtain renewable electricity directly without waiting for the grid average to fall, also explaining the lower national factor. Official transition plans suggest continued declines as offshore wind and solar connect to the grid, although demand growth will influence the pace.
The Gap to the Policy Benchmark: 0.467 vs 0.424
The decline is encouraging, but comparison with the policy benchmark shows substantial challenges remain. The Ministry of Economic Affairs announced as early as 2022 that the “FY2025 (ROC Year 114) Electricity Emission Factor Benchmark” sets the year's benchmark at 0.424 kg CO₂e/kWh, whereas the actual public retailer factor is 0.467, approximately 0.043, or 10%, higher. The benchmark is based on the Executive Yuan's approved second-stage GHG reduction targets and estimated renewable electricity direct supply and wheeling, making it a threshold to be achieved. The shortfall shows that despite progress, the transition must accelerate.
The Headwind of Growing Demand: Semiconductors, AI and Data Centres
The gap reflects Taiwan's structural pressures. Electricity demand from semiconductor manufacturing, artificial intelligence (AI) computing and data centres is rising rapidly, expanding total consumption. A substantial share of additional demand still comes from coal and gas plants, offsetting some benefits of renewable growth and limiting the factor's decline. That the factor keeps falling despite rising demand is primarily attributable to increased shares of renewable and gas generation.
Companies should not mistake a policy benchmark for an achieved figure; reaching it may require years of further effort. Scenario planning should start from the actual announced factor, then conservatively estimate future declines using official transition pathways rather than directly apply an unmet benchmark such as 0.424. Progress depends heavily on renewable deployment, gas supply and dispatch, and the trajectory of electricity demand. Delays in any area may slow the decline. This is one reason electricity-intensive manufacturers should consider procuring green electricity themselves alongside grid decarbonisation.
The Energy Administration emphasises that growing demand requires both continued renewable deployment and low-carbon gas units to support stable dispatch. These investments jointly underpin supply reliability, system resilience and a lower emission factor. Taiwan's net-zero pathway therefore combines renewables, low-carbon gas and system resilience rather than reaching the destination in one step.
Why Global Supply Chains Care About Electricity Emission Factors
A lower factor is more than a domestic policy outcome; it directly affects Taiwanese companies' global supply chain position. Taiwan is export-oriented, with semiconductor, electronics, machinery and textile customers across Europe, the US and Japan increasingly incorporating supplier carbon footprints into procurement criteria. When major brands commit to RE100 (100% renewable electricity) or net zero, decarbonisation requirements cascade upstream to contract manufacturers and component suppliers.
In this context, a lower electricity emission factor means a lower national-level carbon cost. For products covered by EU CBAM, lower embedded electricity emissions mean lower future carbon certificate costs. The Energy Administration lists the industrial factor of 0.466 separately so exporters can use a value closer to industrial electricity patterns in inventories and responses to international customers and customs authorities.
The government factor reflects the cleanliness of the national average under the location-based method. To report a result cleaner than the national average, a company must purchase green electricity or renewable energy certificates itself and disclose under the market-based method. A falling national factor benefits all companies' inventories; showing emissions below that average still requires company-specific green electricity or certificate procurement.
Practical Implications: How Companies Should Prepare Carbon Inventories
For businesses, the factor is an annual inventory parameter, not a distant policy figure. Although a decline brings passive emissions reductions, regulatory and supply chain requirements will become more stringent, so companies still need proactive measures.
How to Calculate Scope 2 Emissions
Indirect emissions from purchased electricity fall within Scope 2 of a GHG inventory. The basic location-based calculation is:
Scope 2 emissions (kg CO₂e) = annual purchased electricity (kWh) × electricity emission factor (kg CO₂e/kWh)
For example, a factory consuming 5 million kWh annually has approximately 2,330 metric tonnes CO₂e of Scope 2 emissions at 0.466. If it also buys green electricity or renewable energy certificates, the market-based method deducts purchased green electricity from consumption to reflect lower actual emissions. In practice, disclose both location-based and market-based figures: this meets dual-reporting requirements in frameworks such as the GHG Protocol and CDP and distinguishes additional reductions from company procurement from benefits due to the falling national factor.
Three Actions to Take Now
After new factors are announced, companies can review these three actions alongside their annual inventory schedules to address changing factors and disclosure requirements.
| Action | Explanation | Why it matters |
|---|---|---|
| Update the factor year | Use the FY2025 (ROC year 114) industrial factor of 0.466 in inventory reports | Avoid distorted data or rejected submissions caused by outdated factors |
| Review green electricity holdings | Confirm purchased green electricity and certificates and disclose using the market-based method | Avoid double counting and reflect actual reductions |
| Set proactive reduction measures | Combine energy efficiency, green electricity procurement and energy management systems | A passive factor decline is insufficient for supply chain requirements and net-zero targets |
Overall, the FY2025 (ROC year 114) public retailer factor fell to 0.467, alongside new industrial, residential and national factors. This has two implications for businesses: reported Scope 2 emissions fall slightly year by year at unchanged consumption, but the gap to the 0.424 benchmark remains while demand and international supply chain expectations rise. Companies should use the appropriate officially announced factor for the relevant year and assess green electricity procurement, energy efficiency and reduction targets as needed.
Manage Sustainability Information in One Place with Sustaihub
For Taiwan’s TWSE/TPEx-listed companies, Sustaihub is a sustainability information management platform combining corporate governance evaluation, sustainability report editing, ESG data collection and third-party verification workflows in one system.
Book a Free 30-Minute Consultation →Frequently Asked Questions
Further Reading
- GHG Protocol September 2025 Update: Three Implications of Scope 2 Revisions for Corporate Electricity Inventories
- Which Corporate Carbon Inventory Standard Should You Use? ISO 14064 vs GHG Protocol
- Still Unsure How to Prepare Inventories in the Four Industry Categories? New Ministry of Environment Calculation Tools and Guidance
Official Sources
- Energy Administration Electricity Emission Factor Page — Official annual factors (source of the FY2025 / ROC year 114 factor of 0.467)
- FY2025 (ROC Year 114) Electricity Emission Factor Benchmark (regulation) — Legal basis for the ROC year 114 benchmark of 0.424
Updated 6 October 2026. This article compiles FY2025 (ROC year 114) electricity emission factors and historical trends as a reference for companies looking up electricity emission factors.