
Carbon inventory data management platform
Manage activity data through verification readiness in one place
Turn activity data scattered across sites into traceable, verifiable inventory records.







Choosing a carbon inventory system
A carbon management platform should support inventory data, factors, evidence, and verification preparation together
When companies search for a carbon inventory system or GHG inventory system, they are usually checking whether their data can meet ISO 14064-1, GHG Protocol, and customer supply-chain requirements. DCarbon centralizes activity data, emission factors, Scope 1-3 calculations, evidence attachments, and inventory reports so carbon data can be verified, traced, and connected to Syber sustainability reporting.
What you can check first
How data comes in
Collect data by organizational boundary, emission source, and scope so each team knows what to provide and can trace the source later.
How factors and calculations are traced
Built-in emission factors and calculation logic keep supporting evidence for pre-verification data checks.
How results are delivered
Extend annual inventory results into reduction tracking, supplier responses, and ESG report disclosures.
Centralized data, better verification readiness
-
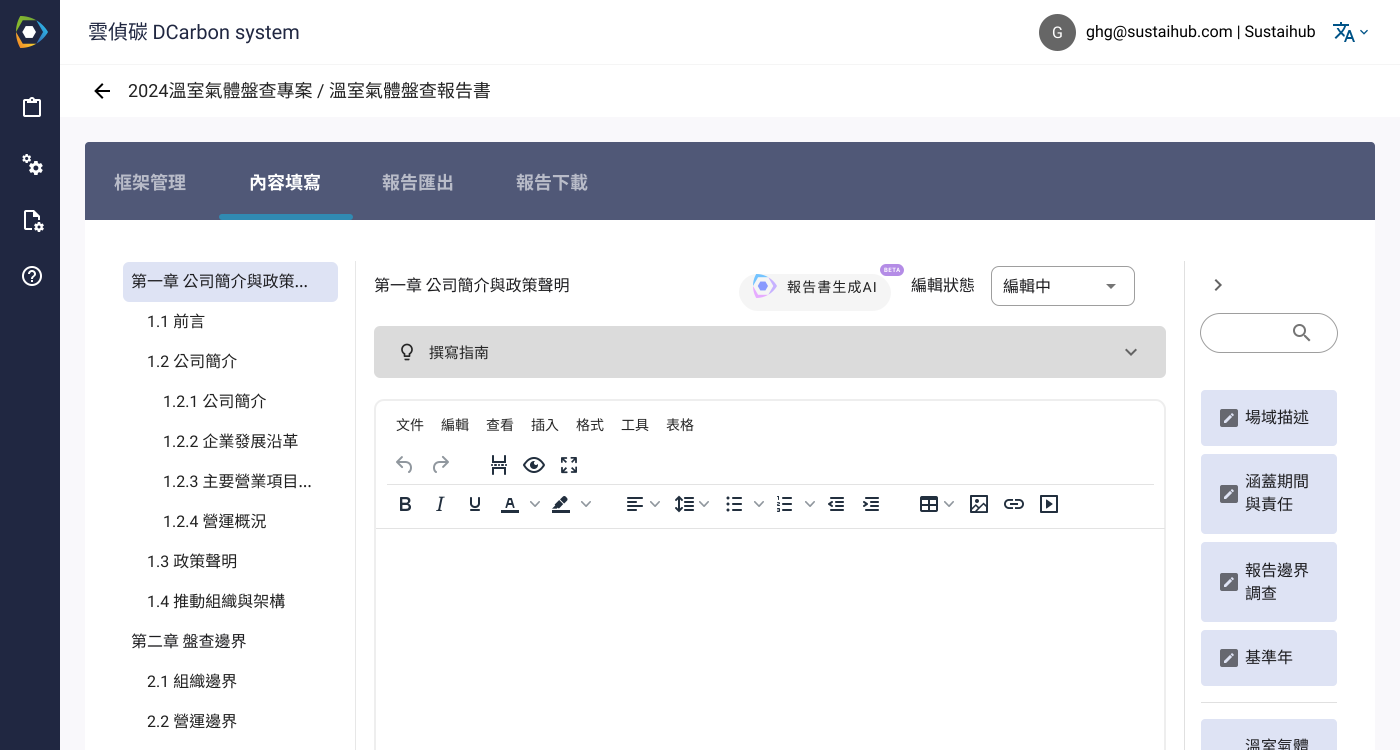
Centralized activity data management
Keep site submissions, attachments, and emission-source data in one inventory project.
-
Traceable factors and formulas
Keep emission factors, calculation logic, and evidence sources for internal review and third-party verification.
-
Inventory results ready to deliver
Inventory results can support supplier replies, reduction tracking, and sustainability report disclosures.
Materiality Assessment
-
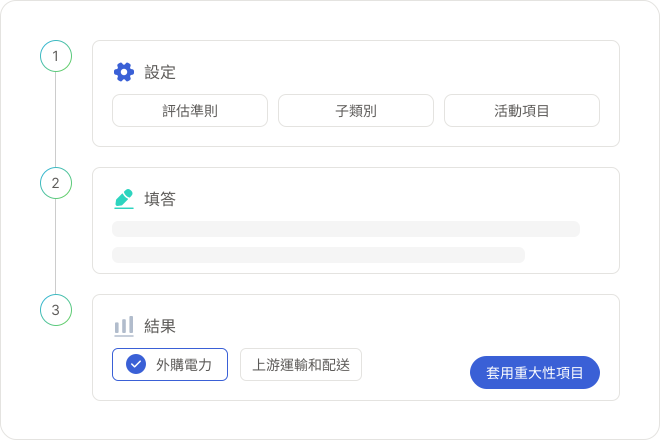
Built-in Assessment Criteria
Built-in assessment criteria help first-time inventory companies get started easily.
-
Fields organized by inventory standard
Categorized according to ISO 14064-1:2018, with complete subcategories and activity item settings.
-
Trackable inventory data collection
Track submission status by emission source and owner to reduce repeated follow-ups and version confusion.
Know the next step even in a first inventory
-
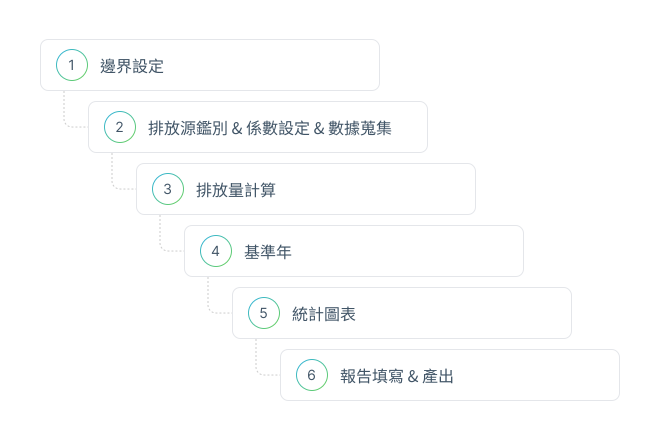
Guided inventory steps
Organize inventory boundaries, emission sources, activity data, and evidence files step by step.
-
Guide with Data Entry Interface
Keep fields and units consistent to reduce cleanup after cross-team submissions.
-
Multi-Language Support.
Support collaboration across sites and team members so data can be reviewed in one workflow.
Interactive Data Visualization
-
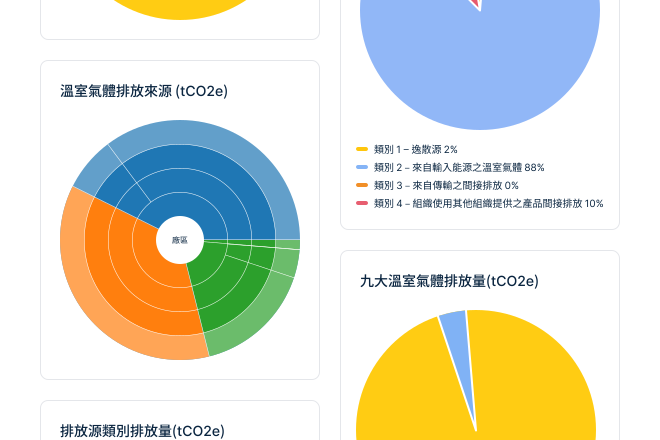
Interactive data visualization
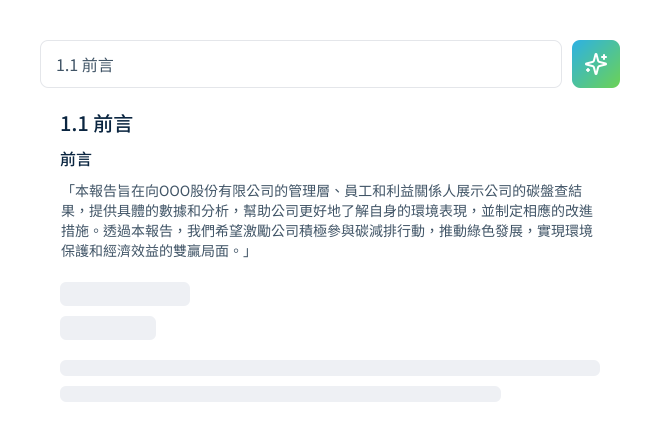
Use charts to quickly identify emission hotspots, data anomalies, and year-over-year changes.
-
Generate Interactive Visualizations
Use emission-source and site distribution to identify which data needs priority review.
-
Intuitive Data Visualization
Help managers understand inventory results and risk areas without digging through spreadsheets.
Fewer follow-ups, less rework
-
Automated Calculation
Calculate from activity data and factor rules so calculation logic stays consistent and each figure remains traceable.
-
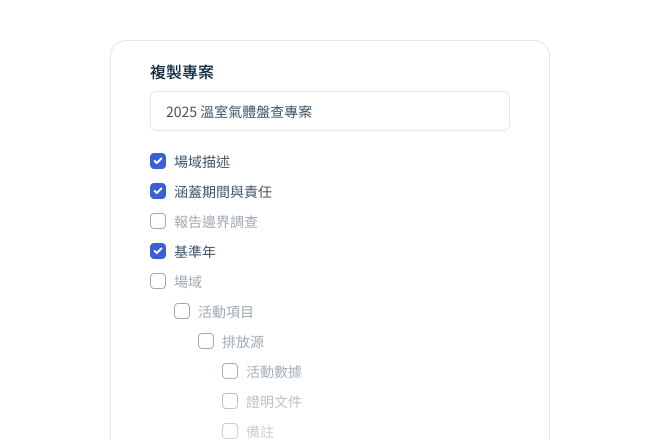
Reuse previous project settings
Reuse organizational boundaries, emission sources, and submission structures so the next-year inventory does not need to be rebuilt.
-
API Data Integration
Plan imports based on existing data sources to reduce manual consolidation.
Extend inventory work into management
-
Compare year-over-year data
Keep annual inventory data to compare changes, track improvements, and respond to customers.
-
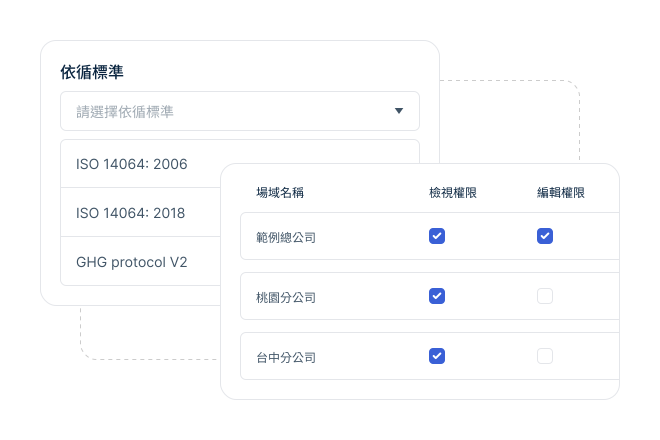
Project Permission Management
Effective management through permission settings based on different access needs.
-
Switch inventory standards
Switch between ISO 14064-1, GHG Protocol, and other configurations based on inventory needs. The company and independent verifier must still confirm applicability and conformity.
Reduce inventory rework and make data and calculations easier to trace
Reuse existing data
50%Reuse previous inventory projects and common emission-source settings so the team does not rebuild the data structure every year.
Less manual cleanup
30%
Upload activity data with templates and use built-in emission factors for calculations, reducing manual copying, matching, and recalculation.
Inventory results and evidence can feed sustainability report disclosures, reducing later back-and-forth for missing data.
Traceable calculations
Calculated based on settingsCalculate from the standards, GWP version, emission sources, and factors selected by the user, then review results by scope and greenhouse gas type. The inventory owner must still confirm boundaries, activity data, and factor settings.
Common Issues and Solutions
The carbon inventory process is time-intensive and prone to errors
Solution:Calculate and compile the inventory from configured boundaries, emission sources, and factors to reduce duplicate entry. The inventory owner must still review the results.
Carbon emission data is difficult to analyze.
Solution:Interactive charts visually present data, helping identify major emission sources.
Challenging regulatory compliance standards
Solution:Organize emissions inventories and reporting fields for the selected standard and identify missing data. The company and independent verifier remain responsible for compliance and verification conclusions.
Complex user interface
Solution:User-friendly interface with simple operation and guided data entry.

Success Stories
The following logos are displayed in alphabetical order.
ASEC International Corporation
Collins Co., Ltd.
Everspring Industry Co., Ltd
Far Eastern Electronic Toll Collection Co, Ltd.
FETC International Co., Ltd.
Innodisk Corporation
NTU Office of Sustainability
TOUNG LOONG TEXTILE MFG. CO., LTD
FAQ
-
A carbon inventory system focuses on inventory data collection, emission factor calculation, and verification evidence. A carbon management platform further integrates Scope 1-3 data, report output, reduction tracking, and sustainability report disclosure. DCarbon supports both inventory work and ongoing management.
-
Yes, simply follow the six-step guide to easily complete the inventory process.
-
Yes, the DCarbon has supported many publicly listed companies in successfully completing ISO 14064-1 inventory projects.
-
Sustaihub not only offers the DCarbon Management System but also provides system training, advisory services, and comprehensive sustainability solutions to support businesses effectively.
-
Yes, we offer consulting services. Pairing with your own consultants is also welcome.
-
The system currently supports Traditional Chinese, English, and Simplified Chinese.
-
Yes, the system can switch between standards and GWP value versions at any time.
-
We primarily offer an online cloud collaboration system using SaaS architecture, with the overall implementation process typically completed within one month, depending on the specific circumstances of the business.
View DCarbon inventory workflow
Choose a product and leave your contact details.
Related Products & Services
Build Complete Sustainability Digital Solutions
Syber Sustainability Report System
Keep section ownership, data collection, AI drafts, and review records in one workflow.
View Syber workflowSustainAI Database
Search peer reports, disclosure examples, and page references to find useful practices first.
Search reportsGHG Consulting
Support for inventory boundaries, activity data, factor selection, carbon footprint work, and SBTi target setting.
See implementation path