
Following the original report's chapter order, we first examine the international landscape and regional changes, then Taiwan's position and regulatory timeline. All data come from the original report; Gregorian years accompany ROC calendar years throughout.
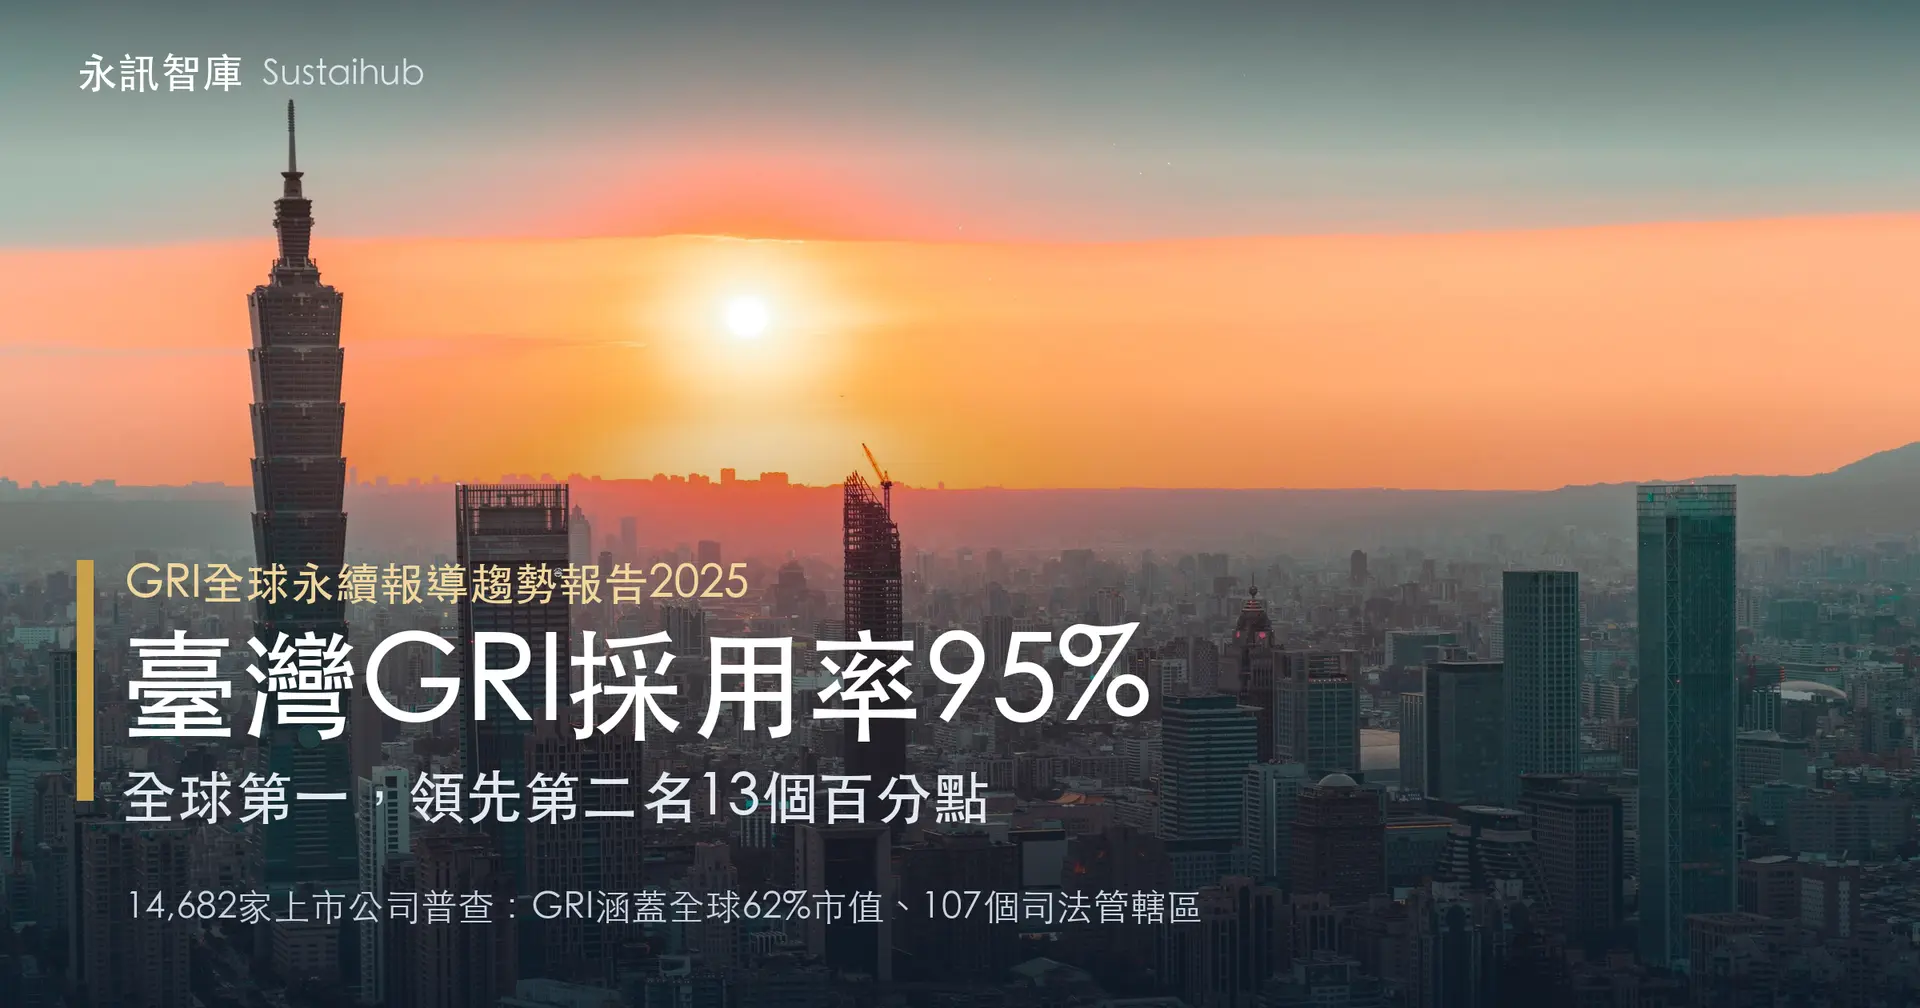
Globally, 87% of large listed companies publish sustainability reports, and 40% reference GRI. GRI users represent 62% of global market capitalisation, leading all frameworks. Taiwan ranks first under both company-count and market-capitalisation measures, at 95%. Sustainability reporting has been mandatory for all TWSE/TPEx-listed companies in Taiwan since 2025 (ROC year 114), while IFRS Sustainability Disclosure Standards apply in three phases from fiscal year 2026 (ROC year 115).
What the Report Measures: A Global Review of 14,682 Large Listed Companies
Before interpreting the figures, consider how the study was conducted. Its methodology determines how far the findings can be generalised.
Sample and Threshold: Listed Companies with Revenue Above US$250 Million
GRI screened major financial market databases for listed companies worldwide with Annual Revenue Above US$250 Million, yielding a sample of 14,682. GRI explains that revenue is an objective, externally verifiable threshold unaffected by a company's own reporting practices. It captures companies with greater sustainability impacts and reporting of greater relevance to investors and regulators.
Classification uses automated text analysis: any company mentioning a framework in its sustainability disclosures is counted as a user. For its own standards, GRI additionally distinguishes “formal use”, meaning reports containing a GRI content index or statement of use.
GRI explicitly acknowledges the sample's limitations: the study focuses on large listed companies and does not represent all large businesses or all listed companies. Jurisdictions with fewer than 20 companies in the full Annex 1 list are excluded from the rankings to avoid misleading small-sample comparisons.
Timing Matters: Collected in December 2025, Mostly Reflecting Fiscal Year 2024
The latest available sustainability report from each company was downloaded in December 2025. GRI explicitly notes that Most of the Sample Reflects Fiscal Year 2024 reporting.
This matters when interpreting annual changes. The reported changes from 2024 to 2025 compare the latest reports available at two collection dates, rather than matched year-on-year versions of the same report. Keeping this timing difference in mind helps interpret the regional shifts below more accurately.
Global Picture: 87% Publish Reports; GRI Covers 62% of Market Capitalisation
Distribution Across Four Company Types
Among the 14,682 sampled companies, 87% Publish Sustainability Reports or Related Disclosures, while only 13% publish none. By framework use, companies fall into four groups:
| Type | Share of Companies | Share of Market Capitalisation |
|---|---|---|
| Formal GRI Users (Content Index or Statement of Use) | 23% | 40% |
| Informal GRI Users (Mention GRI in Their Reports) | 17% | 23% |
| Reporters Not Using GRI | 47% | 35% |
| No Sustainability Report | 13% | 2% |
Two comparisons stand out. First, formal and informal GRI users together make up 40% of companies but 62% of market capitalisation (the 40% and 23% in the table are rounded; the report gives the combined figure as 62%), indicating substantially larger average size. Second, the 13% publishing no sustainability report account for only 2% of global market capitalisation, suggesting non-reporters tend to be smaller.
The OECD's Global Corporate Sustainability Report 2025 uses a slightly different methodology and finds that GRI users represent 61% of global market capitalisation, close to GRI's own 62%. The two studies corroborate one another.

The Positive Relationship Between Company Size and Adoption
The report divides companies into five revenue bands, with adoption increasing consistently with size:
Source: GRI, The State of Sustainability Reporting 2025, Figure 2 | Compiled by Sustaihub
Adoption is 28% in the smallest band and 58% in the largest, a 30-percentage-point gap. This also explains wide differences between studies: KPMG's survey of the world's 250 largest companies found 77% use GRI. The more a sample concentrates on very large companies, the higher the rate naturally becomes. Companies should benchmark against peers with similar revenue rather than the global average alone.
The Framework Landscape: GRI, TCFD, SASB, ISSB and ESRS
Eight Major Frameworks Compared by Company Count and Market Capitalisation
The report tracks eight major frameworks. Throughout this article, “usage” follows GRI's research definition: a company references or mentions a framework in sustainability disclosures. It does not mean full compliance with every requirement:
| Framework / Standard | Number of Companies | Share of Companies | Share of Market Capitalisation |
|---|---|---|---|
| GRI | 5,839 | 40% | 62% |
| SDGs | 5,839 | 40% | 50% |
| TCFD | 4,939 | 34% | 59% |
| SASB | 3,440 | 23% | 45% |
| CDP | 3,039 | 21% | 51% |
| ISSB | 1,848 | 13% | 21% |
| ESRS | 1,514 | 10% | 18% |
| TNFD | 1,047 | 7% | 16% |
GRI leads in both company count and market capitalisation.TCFD is closest by company count (34%), but trails GRI by 3 percentage points in market capitalisation. The newer ISSB Standards, ESRS, TNFD currently have low global usage, at 13%, 10% and 7%, respectively.
The United Nations SDGs have the same company count as GRI (5,839), but a lower market-capitalisation share, 50% versus 62%. GRI explains that the SDGs were not originally designed as a reporting framework; companies commonly map disclosures of their impacts to the relevant goals.
Low ISSB and ESRS figures reflect the observation date, not their long-term position. Most data reflect fiscal year 2024, while 2025 was the first year some EU companies prepared ESRS reports under the CSRD. GRI expects framework usage to keep shifting as regulations take effect and standards become more integrated.
Why Market Capitalisation Can Reveal More Than Company Counts
Every statistic in the report includes both a company share and a market-capitalisation share, often with sizeable differences. For example, only 10% of companies globally use ESRS, but within the EU, 55% of assessed companies do so, representing 65% of the region's market capitalisation.
Market capitalisation captures users' weight in capital markets. When a framework is prevalent among high-value companies, it materially shapes supply chain and investor disclosure expectations, even if the number of users looks small. For Taiwanese suppliers, customers' chosen frameworks often matter more than global average adoption rates.
No Single Framework: Using Several Is the Norm
83% of SASB Users Also Use GRI
A central finding is that sustainability reporting is not a single-framework exercise. Large listed companies commonly use multiple standards to meet different stakeholders' information needs.
Source: GRI, The State of Sustainability Reporting 2025, Figure 3 | Compiled by Sustaihub
Among SASB users, 83% also reference GRI. The figures are 80% for ISSB, 78% for TNFD, 72% for TCFD and 70% for ESRS. Most companies adopting these frameworks therefore continue impact disclosure alongside them.
GRI frames this as complementarity: different standards address different information needs and audiences. It also lists collaboration with the IFRS Foundation, TNFD, TISFD, CDP, ISO, GHG Protocol and SBTi, aimed at improving interoperability and reducing duplicate work.
Interoperability and the Expanding Reach of Impact Disclosure
The report proposes a useful long-term measure: rather than looking only at GRI usage, track how many jurisdictions make impact disclosure standard practice.
In the EU, for example, ESRS implementation has reduced the number of GRI users, but ESRS itself requires impact disclosure through Double Materiality, bringing 30 countries under impact reporting requirements. Adding India's BRSR and China's ISSB-based rules requiring impact disclosure, the report estimates that Jurisdictions Representing Approximately 40% of Global GDP Are Covered by Impact Disclosure. Within the EU, 68% of companies and 80% of market capitalisation disclose impacts using GRI, ESRS or both.
Regional Divergence: Asia and Latin America Rise as Europe and North America Level Off
Regional Adoption Rankings
Regional GRI adoption varies widely, with 39 percentage points between the highest and lowest:
Source: GRI, The State of Sustainability Reporting 2025, Figure 5 | Compiled by Sustaihub
Southeast Asia leads at 62%, while the United States and Canada are lowest at 23%. GRI attributes these differences to local regulations, institutional arrangements and market expectations.
The report also analyses the Global South, defined as G77 countries plus China. It hosts the headquarters of 42% of GRI users. Adoption there is 43%, slightly above 38% elsewhere; the market-capitalisation gap is larger, at 71% versus 60%.
Declines Are Not Unique to GRI: Other Frameworks Also Weakened
On comparable samples, GRI adoption edged down from 42% in 2024 to 40% in 2025. The aggregate masks opposing trends: declines in Europe, both EU and non-EU, North America and Oceania, alongside growth in Asia, Africa, the Middle East and Latin America.
GRI attributes Europe's decline to new ESRS requirements, and the US decline to a new political cycle and uncertainty over federal and state reporting rules.
Other frameworks declined by similar amounts over the same period: SASB fell 2%, CDP 2% and TCFD 3%, while references to the SDGs fell 4%.
GRI argues that lower usage and reduced impact reporting should be examined separately. EU companies switching to ESRS still disclose impacts under double materiality, so the substantive reach of impact reporting has expanded. The report recommends tracking the number of jurisdictions where impact reporting becomes standard practice. Using a 50% GRI adoption threshold, 45 jurisdictions currently meet that benchmark.
Taiwan Leads at 95%: What the 478-Company Sample Means
Taiwan Tops Both Rankings
Annex 1 provides full jurisdiction-level data. Taiwan contributes 478 companies to the sample, with 95% GRI Adoption by Both Company Count and Market Capitalisation, ranking first under both measures.
| Ranking Basis | 1st | 2nd | 3rd | 4th | 5th |
|---|---|---|---|---|---|
| By Company Count | Taiwan 95% | Argentina 82% | Colombia 79% | Switzerland 76% | Singapore 76% |
| By Market Capitalisation | Taiwan 95% | Argentina 93% | UAE 92% | Spain 89% | Belgium 87% |
The lead is particularly pronounced by company count: Taiwan is 13 percentage points ahead of Argentina. Page 13 of the report states that Taiwan has the highest GRI reporting rate of all jurisdictions.
GRI flags a comparison limitation: although jurisdictions with fewer than 20 companies are excluded, company counts and market sizes still vary considerably, so direct comparisons require caution. Taiwan's 478-company sample differs substantially from Argentina's 39 and Colombia's 29.
Ten-Market Comparison: Taiwan Against South Korea, China, Japan and the US
Placing the ten markets with the most sampled companies side by side clarifies Taiwan's position:
| Market | Sample Companies | Share of Companies | Share of Market Capitalisation |
|---|---|---|---|
| Taiwan | 478 | 95% | 95% |
| South Korea | 711 | 48% | 71% |
| European Union (Combined) | 1,500 | 47% | 64% |
| India | 697 | 37% | 66% |
| Australia | 235 | 37% | 73% |
| China | 2,937 | 34% | 68% |
| Japan | 1,715 | 32% | 65% |
| Canada | 325 | 28% | 39% |
| United Kingdom | 384 | 28% | 65% |
| United States | 2,307 | 23% | 57% |
Taiwan's 95% is 47 percentage points above second-place South Korea's 48%. It is also the only market on this list with identical company-count and market-capitalisation shares; all others have substantially higher market-capitalisation shares. Elsewhere, larger companies dominate GRI adoption. In Taiwan, non-users account for only about 5% under either measure, so adoption is not concentrated among the largest companies. The report does not break Taiwan down by company-size bands, but the matching measures are consistent with mandatory reporting for all TWSE/TPEx-listed companies.
This structural difference is directly related to Taiwan's regulatory design, discussed next.
Taiwan's Two Regulatory Timelines: Universal Sustainability Reporting and Three-Phase IFRS Adoption
Sustainability Reports: All TWSE/TPEx-Listed Companies Since 2025 (ROC Year 114)
The Financial Supervisory Commission's (FSC) October 17, 2024 press release, “FSC Reminds All TWSE/TPEx-Listed Companies to Prepare Sustainability Reports from Next Year (ROC 114)”, states that companies with paid-in capital of NT$2 billion or less must prepare reports for fiscal year 2024 (ROC 113) starting in 2025 (ROC 114), with filing due by the end of August 2025.
This brought all TWSE/TPEx-listed companies into mandatory reporting. It explains why Taiwan's adoption is both high and not concentrated among the largest businesses. Taiwanese companies generally follow GRI when preparing sustainability reports, raising GRI's measured adoption rate.
IFRS Sustainability Disclosure Standards: Three Phases from FY2026 (ROC Year 115)
The other timeline concerns adoption of IFRS Sustainability Disclosure Standards—IFRS S1 and S2 issued by the ISSB. The FSC's January 20, 2026 press release reminding listed companies to prepare early for adoption sets out three phases:
| Phase | Paid-in Capital | Applicable Fiscal Year | First Filing Year |
|---|---|---|---|
| Phase One | NT$10 billion or more | FY2026 (ROC year 115) | 2027 (ROC year 116) |
| Phase Two | NT$5 billion to less than NT$10 billion | FY2027 (ROC year 116) | 2028 (ROC year 117) |
| Phase Three | Less than NT$5 billion | FY2028 (ROC year 117) | 2029 (ROC year 118) |
The press release defines the capital threshold by paid-in capital at the end of the reporting period of the fiscal year for which sustainability-related financial information is prepared. This roadmap was first released on August 17, 2023.
Comparing GRI's Description with FSC Announcements
Explaining Taiwan's leading adoption rate on page 13, the GRI report states: “GRI reporting is highest of all in Taiwan (China), where GRI and ISSB are both mandatory as of 2025.”
The FSC's official announcements show different statuses for the two timelines:
- Sustainability Reports: mandatory for all TWSE/TPEx-listed companies from 2025 (ROC year 114), consistent with GRI's stated timing.
- IFRS Sustainability Disclosure Standards: Phase One applies to FY2026 (ROC year 115), with filings from 2027 (ROC year 116); they were not universally mandatory in 2025.
When scheduling internal work, use the FSC's three-phase timetable and thresholds, and confirm the applicable phase and fiscal year from your paid-in capital. International reports may simplify national regulations and should not determine compliance deadlines. Companies near NT$5 billion or NT$10 billion should pay particular attention to the use of paid-in capital at the reporting period's end.
Industry Differences: GRI Covers 82% of Electronics Market Capitalisation
High- and Low-Adoption Industries
Annex 2 provides industry-level statistics, with similarly substantial differences:
| Industry | Sample Size | Share of Companies | Share of Market Capitalisation |
|---|---|---|---|
| Oil and Gas | 351 | 46% | 85% |
| Electronics | 1,307 | 47% | 82% |
| Water Transport | 96 | 55% | 79% |
| Air Transport and Logistics | 75 | 48% | 73% |
| Food and Beverages | 614 | 43% | 70% |
| Chemicals | 820 | 41% | 68% |
| Software | 653 | 28% | 67% |
| Wholesale and Retail | 1,250 | 33% | 67% |
| Healthcare Services | 152 | 26% | 29% |
| Food Services | 122 | 27% | 28% |
GRI reports cover more than 80% of market capitalisation in oil and gas and electronics, but less than 30% in healthcare and food services.

GRI stresses that a low company-count share should be assessed alongside those companies' market capitalisation. In its view, high market value corresponds to large impacts, and these companies' disclosure practices shape stakeholder expectations across the industry. For software, only 28% of companies use GRI, but they represent 67% of industry market capitalisation.
The International Position of Taiwan's Key Industries
Electronics has the largest industry sample, at 1,307 companies; GRI users represent 82% of its market capitalisation. For Taiwan's electronics and semiconductor supply chains, this means large, high-value global electronics companies—often their international customers—mostly already disclose under GRI. However, adoption by company count is 47%, so individual suppliers should still check major customers' actual requirements.
Unlisted supply chain SMEs outside mandatory sustainability reporting may still be required by customer supplier assessments to provide data aligned with GRI. Usage of GRI 308 Supplier Environmental Assessment and GRI 414 Supplier Social Assessment is 42% each, indicating that roughly four in ten GRI reporters disclose supplier assessment information.
How Companies Can Use This Report
Use Topic Standard Rankings to Assess Disclosure Completeness
Annex 3 lists usage rates for all GRI Topic Standards, offering a reference for benchmarking disclosure scope:
| GRI Topic Standard | Usage Rate |
|---|---|
| GRI 305: Emissions 2016 | 62% |
| GRI 302: Energy 2016 | 61% |
| GRI 403: Occupational Health and Safety 2018 | 60% |
| GRI 405: Diversity and Equal Opportunity 2016 | 59% |
| GRI 404: Training and Education 2016 | 59% |
| GRI 401: Employment 2016 | 59% |
| GRI 201: Economic Performance 2016 | 56% |
| GRI 306: Waste 2020 | 56% |
| GRI 205: Anti-corruption 2016 | 56% |
| GRI 303: Water and Effluents 2018 | 54% |
Emissions, energy and occupational health and safety lead, disclosed by roughly three in five GRI users. GRI 411 Rights of Indigenous Peoples and GRI 410 Security Practices are lowest at 17% each, followed by GRI 415 Public Policy and GRI 402 Labor/Management Relations at 24% each.
GRI emphasises that Topic Standards should be selected based on materiality assessment, not to maximise the number of disclosures. These rankings help identify common disclosure breadth. If a company discloses nothing on a widely used topic, it is worth revisiting whether its materiality assessment has sufficient support.
For Sector Standards, the first three—oil and gas, coal and agriculture—have been in effect for several years. Among GRI users in those industries, 36% already report under the relevant Sector Standard.
GRI 102 and GRI 103: Effective from 2027
A related development is the completed revision of climate and energy disclosures covered by the two most-used Topic Standards. Following GSSB approval, GRI officially published GRI 102: Climate Change 2025 (Climate Change) and GRI 103: Energy 2025 (Energy) on June 26, 2025, applicable to reports Published on or After January 1, 2027. GRI states that the revision reviewed and updated GRI 302 Energy, climate-related disclosures in GRI 305 Emissions (305-1 to 305-5), and GRI 201-2 Financial implications and other risks and opportunities due to climate change. It is not simply a wholesale renumbering of two standards. Companies should consult GRI's official transition guidance on how old and new requirements replace and integrate with one another.
GRI 305 Emissions (62%) and GRI 302 Energy (61%) rank first and second in this study, so the revision will affect the vast majority of GRI reporters. When planning data collection for 2027 reports, companies can review the new requirements now to avoid reconstructing historical data later.
Frequently Asked Questions
What Are GRI Standards, and How Do They Differ from ISSB and ESRS?
GRI Standards are sustainability reporting standards developed by the Global Reporting Initiative, focusing on companies' Impacts on the environment, society and economy. IFRS S1 and S2 issued by the ISSB focus on the Financial Effects of sustainability issues on companies, primarily serving investors. ESRS, required under the EU's CSRD, uses Double Materiality to cover both impact and financial perspectives. They meet different information needs and are not mutually exclusive. GRI's latest report finds that 80% of ISSB users and 70% of ESRS users also reference GRI. Using multiple frameworks is the prevailing practice.
How Was Taiwan's 95% GRI Adoption Rate Calculated?
The figure comes from GRI's The State of Sustainability Reporting: Global Trends in the GRI Standards 2025. GRI selected 14,682 listed companies worldwide with annual revenue above US$250 million from financial market databases, including 478 in Taiwan. In December 2025, it downloaded each company's latest sustainability report and used automated text analysis to identify references to GRI Standards. Among Taiwan's sample, 95% referenced GRI; the market-capitalisation measure was also 95%, ranking first globally on both. The sample covers only listed companies meeting the revenue threshold, not all Taiwanese businesses.
Does the Decline from 42% to 40% Mean Sustainability Reporting Is Losing Momentum?
The report attributes the 2-percentage-point change to opposing trends: declines in Europe, North America and Oceania, alongside growth in Asia, Africa, the Middle East and Latin America. Other frameworks fell similarly—SASB and CDP by 2% each, TCFD by 3%—indicating a broader pattern. Europe's decline largely reflects switching to ESRS, which itself requires impact disclosure through double materiality, expanding the substantive reach of impact reporting. GRI suggests tracking jurisdictions where impact reporting becomes standard practice; 45 currently have GRI adoption of at least 50%.
Which Companies in Taiwan Must Prepare Sustainability Reports?
The FSC's October 17, 2024 press release requires TWSE/TPEx-listed companies with paid-in capital of NT$2 billion or less to prepare FY2024 (ROC 113) sustainability reports from 2025 (ROC 114), filing by the end of August 2025. This brought all TWSE/TPEx-listed companies into mandatory reporting. It also helps explain why Taiwan's GRI adoption is not concentrated among large companies, unlike the structure in most other markets.
When Do IFRS Sustainability Disclosure Standards Apply in Taiwan?
The FSC's January 20, 2026 press release sets three phases. TWSE/TPEx-listed companies with paid-in capital of at least NT$10 billion apply the standards from FY2026 (ROC 115), filing from 2027 (ROC 116). Those with NT$5 billion to less than NT$10 billion apply them from FY2027 (ROC 116), filing from 2028 (ROC 117). Those below NT$5 billion apply them from FY2028 (ROC 117), filing from 2029 (ROC 118). Capital is measured at the end of the reporting period for which sustainability-related financial information is prepared, so companies near thresholds should confirm their phase carefully.
Do Companies Need Both GRI and IFRS S1/S2?
In Taiwan, sustainability reports and the sustainability-related financial information section of the annual report are parallel tasks. The former is universally mandatory for listed companies; the latter follows the three-phase timetable. Internationally, combined use is common: 80% of ISSB users also reference GRI. Their purposes differ: ISSB addresses investors' needs for financial effects, while GRI covers broader stakeholders and impacts. Companies can identify shared data foundations, such as greenhouse gas emissions and energy use, to reduce duplicate collection.
Which GRI Topic Standards Are Most Widely Disclosed?
Annex 3 ranks GRI 305 Emissions (62%), GRI 302 Energy (61%) and GRI 403 Occupational Health and Safety (60%) first, followed by GRI 405 Diversity and Equal Opportunity, GRI 404 Training and Education and GRI 401 Employment at 59% each. GRI 411 Rights of Indigenous Peoples and GRI 410 Security Practices are lowest at 17%. GRI stresses that selection should follow materiality assessment. The ranking is a guide to peers' disclosure breadth, not a checklist to copy.
When Do GRI 102 Climate Change and GRI 103 Energy Take Effect?
Following GSSB approval, GRI published GRI 102: Climate Change 2025 and GRI 103: Energy 2025 on June 26, 2025, for reports published on or after January 1, 2027. Since GRI 305 Emissions and GRI 302 Energy are currently the most-used Topic Standards, the revision will affect the vast majority of GRI reporters. Companies planning data collection for 2027 reports should review the new requirements in advance to avoid reconstructing historical data later.
Related Reading
- TWSE's Review of 2024 Sustainability Reports: Nine GRI Gaps and Climate Disclosure Recommendations
- 2026 IFRS Sustainability Disclosure Standards FAQ: S1, S2, Adoption Timelines and Scope 3
- 2025 Sustainability Reporting Rules Update: Key Filing Requirements
Sustaihub's Syber Sustainability Reporting System includes GRI mapping and chapter guidance to digitise report preparation. If you are planning parallel GRI and IFRS sustainability disclosure workflows, contact our advisory team.
Explore the Syber Sustainability Reporting System Contact Our Advisory TeamSources
- GRI, The State of Sustainability Reporting: Global Trends in the GRI Standards 2025 (published June 2026; Report PDF)
- OECD, Global Corporate Sustainability Report 2025 (using a different methodology, finds GRI users account for 61% of global market capitalisation, corroborating GRI's figures)
- FSC: All TWSE/TPEx-Listed Companies Must Prepare Sustainability Reports from 2025 (ROC Year 114) (press release, October 17, 2024)
- FSC: Implementation Schedule for IFRS Sustainability Disclosure Standards for Listed Companies (press release, January 20, 2026)
- GRI, Topic Standard for Climate Change and Energy (GRI 102 and GRI 103 were published June 26, 2025 and apply to reports published from January 1, 2027)
Sources: GRI, The State of Sustainability Reporting: Global Trends in the GRI Standards 2025 (June 2026); OECD Global Corporate Sustainability Report 2025; and FSC press releases. The original GRI report labels Taiwan as “Taiwan, China” in its charts. This article uses “Taiwan” in the text; cited data are unchanged. Gregorian years accompany ROC calendar years throughout.